A Review of Operational Research in Developing Countries
(with a focus on Planning Energy Systems)
Abstract
The use of operational research to solve developmental problems in developing countries first began in the 1950s, but the first official global meeting for this purpose was not held until 1992. Since then the OR community has been making strides with using operational research to support developing countries. The benefits of operational research have been experienced across the globe and in diverse applications. One such application is improving energy supply for the ever growing energy demands in Beijing, China and India. Both studies seek a more evolved understanding of the uncertainties of resource supply and energy demand so that educated decisions can be made to develop energy systems in their respective countries.
1. Introduction
In the past, the term 'developing country' has been used as a catch all for all those that are not developed or undeveloped. Countries in this category do not share many qualities, there is no precise characteristic shared amongst them all (Pritchett, 1997). The World Bank categorises countries into 4 groups based on their Gross National Income, and the International Monetary Fund has two divisions: Advanced Economies, and Emerging and Developing Economies. It can be surmised that classifying countries as 'Developed', 'Developing', and 'Under Developed' is antiquated. For the purpose of this review any country that does not have an advanced economy or high income per capita will be defined as 'developing'.
The relationship between Operational Research and Developing Countries is thought to have begun at latest in the late 1950s (Bornstein and Rosenhead, 1990). Over forty years later in December 1992, the first International Conference on OR for Development took place in Ahmedabad, India. The meeting culminated with the notion to use Operational Research as a tool to further development and economic advancement in 'developing' countries (Whitea et al., 2011).
However, there are several challenges with utilising and implementing operational research techniques in 'developing' countries. For instance, without human capital, developing countries would not have the local specialist needed to conduct such research. This lack of resource can be tied to not having the proper education or brain drain of those who do. Wide-spread brain drain is closely associated with having an adverse impact on economic development (Docquier et al., 2007). Another consideration is access to big data, the role of which many countries and business leaders are important in propelling development forward (Long & Brindley, 2013). But poor data infrastructure, and inadequately trained personnel are hurdles that developing countries must overcome before they can benefit from big data (Luna et al., 2014). Lastly, technological progress is a must-have to join the ranks of countries with advanced economies (Petralia et al., 2017), without which operational research can only do so much to support developing countries with industrial development and economic growth.
In 2015 at a United Nations conference, 195 nations agreed upon 17 sustainability goals that they would like to achieve by 2030. Some of these goals include climate action, good-health and wellbeing, and sustainable cities and communities. This paper begins by exploring how operational research techniques have and can be used to help achieve some of these sustainability goals, while the main literature review will focus on 'Planning Energy Systems in Developing Countries' (specifically India, and Beijing, China).
2. Areas of Research
2.1 Allocating Healthcare Professionals
Regardless of the development status of a country a shortage of healthcare professionals is a universal problem. In Haryana India there is not only a lack of doctors, but the quantity of doctors allocated to health centres are not distributed based on the needs of the area, and there is problem with sporadic absenteeism from many doctors. Circumstantially, it is not easy to numerate the probability of absenteeism. To tackle these issues, a heuristic encompassing linear programming is constructed to maximise the number of patients attended to by doctors each day (Goyal and Yadav, 1979).
Focusing on their emergency department, a government hospital in Kuwait also wants to maximise the number of patients seen. Ahmed and Alkhamis (2008) go a step further by simulating the process a patient would go through upon entering the emergency department until their dismissal. Combining the simulation model with a discrete stochastic optimisation model, Ahmed and Alkhamis (2008) optimise the quantity of nurses, doctors and lab technicians needed in the emergency department.
In poverty-stricken Haiti, mortality rates are high and communities rely on healthcare workers (not doctors). Parker et al. (1988) aim to maximise "health "benefit" to a regional population"; benefits are specified as decreased mortality rates and optimised time spent treating various health issues. The limitations on healthcare workers, finances and other resources lead Parker et al. (1988) to handle this as a resource allocation problem.
2.2 Balancing Nutrients in Local Diets
Children in many developing countries suffer from malnutrition. To achieve the World Health Organisations recommendations of improved feeding practices. Ferguson et al. (2006) used goal programming to optimise diets based on local ingredients and cuisine that meet the numerous nutritional needs of children. The technique of goal programming is quite fitting for addressing this problem; as Romero (1991, pg ix) describes, "Goal Programming attempts to combine the logic of optimisation in mathematical programming with the decision makers' desire to satisfy several goals."
Over the years Mathematical Programming has become a common technique for solving diet problems, whether they be malnourished children, feeding soliders in war or educating adults on having a balanced diet (van Dooren, 2018). With the intention of education mothers of infants in West Lombok, Indonesia about feeding their children key nutrients (zinc, calcium, niacin and iron); Fahmida et al. (2015) developed a linear programming model to create complimentary feeding recommendations (CFRs) to supplement the missing nutrients.
2.3 Transportation Pollution
Growing populations in dense urban cities intensify the fight for space. Businesses such as manufacturers and warehouser that need a lot of it are all now located outside of cities. To get their goods in, freight trains (and other modes of transport) are used. Freight trains discharge copious amounts of noise pollution, air pollution, and greenhouse gases that are unsustainable and harmful to both people and the environment. In the past, the optimisation of freight train schedules and networks did not include consideration for pollution and sustainability. Bandeira et al. (2018) proposed using a fuzzy multi-criteria decision making approach to confront these issues of pollution and sustainability and to suggest a less harmful approach to distribution chains and urban deliveries. In Tehran, the scope is broadened a little to include the transportation of passengers on a railway. The fuel consumption of both these trains have unsustainable amounts of carbon emission. Using a mixed integer nonlinear model, Miandoab et al. (2019) suggest carbon emissions can be decreased by optimising the schedule taking into consideration the carbon emission factor related to weight and prioritisation of trains.
2.4 Disaster Relief
Natural disasters spawn damage and uncertainty. When they strike, residents of communities and even countries may be displaced from their homes. Turkey is one such country that is susceptible to natural disasters that cause its citizens to become homeless overnight. To aid in these catastrophes governments need to have procedures in place to quickly assemble temporary shelters to house citizens. Using mixed integer linear programming, Kilci et al. (2014) were able to select ideal locations for temporary shelters.
Basic goods such as food and clothing also suddenly become inaccessible. It is difficult, to be fully prepared for a disaster, but preparatory measures to the fullest extent must be put in place to ensure these resources are available. Khayal et al. (2015, p.22) propose using "a network flow model for dynamic selection temporary distribution facilities and allocation of resources for emergency response planning", in which excess resources are transferred between facilities in response to disasters.
3. Planning Energy Systems
3.1 Defining The Problem
Modern day society has become dependent on electricity, so much so that at this rate supply cannot meet demand. Population sizes are continuously increasing, thereby requiring higher quantities of supplied energy and more planning for the provision of energy sources in the present and future. As societies all around the globe continue to grow technologically and in population size, reliance on products that need to be fuelled by energy is exponentially increasing- from lighting homes at night to powering manufacturing facilities.
How two different societies have chosen to approach this supply shortage will be reviewed and compared within this report. They are described in'Production and maintenance planning for electricity generators: modelling and application to Indian power systems,' by Chattopadhyay (2001), and 'An interval full-infinite mixed-integer programming method for planning municipal energy systems- A case study of Beijing' by Zhu et al. (2011).
In both instances the overarching goal is to improve planning and production of energy supplies, but on a granular level they differ from one another. Chattopadhyay (2001) focuses on optimising currently available resources for no more than a year into the future. The commissioners of the research also stated that it is of utmost importance to maintain the existing distribution of planned outages while minimising cost is secondary. Conversely, Zhu et al. (2011) have been permitted much more flexibility- if additional resources are needed they will be allocated. Additionally, the objective function is defined by minimising costs while taking into consideration limits on pollution, machinery depreciation, supply costs, selling prices, capacity expansion, etc.
Though this review focuses on cases in India and Beijing it is a common global issue. Both of the reviewed approaches use a form of linear programming to solve their version of planning energy systems. The studies were conducted over a decade apart and in different parts of the world, but their main objectives still remain the same- how to supply energy when demand is both uncertain and increasing, and natural resources are finite.
3.2 Power Systems in India
3.2.1 Introduction to Full Problem
Year over year, demand for energy has increased by over 10% in India. Annual seasonal patterns can be found within the data, and throughout each individual day there is a wide range in difference between peak and low energy usage. During daily peaks, approximately 20% of those who need energy go without, because current supply cannot meet such a high demand. Other times when citizens are without electricity it is because there is a power outage. The Northern Regional Electricity Board (NREB) groups these outages into two categories: planned and unplanned. Planned outages occur when transmission networks are shut off for maintenance, and unplanned (also called forced) outages can happen for various reasons such as a faulty wire.
Within a 36-year period, India's energy production capacity has increased by 44.44x since 1961. If increase was steady from year to year, each year's capacity grew by 11.12%. To create energy, India depends on coal (62%) and hydropower (28%) as fuel supplies. The Norther Regional Electricity Board supplies electricity to seven states; their transmission network consists of 238 interconnected generating units.
The NREB performs annual research to plan ahead for the coming year. There are three outcomes they are most interested in: a) a review of the current energy process, b) a proposal for potential improvements, c) a demonstration of the effectiveness of b. Though their main purpose is not to focus on specifically addressing the energy supply shortage, it is modelled this way.
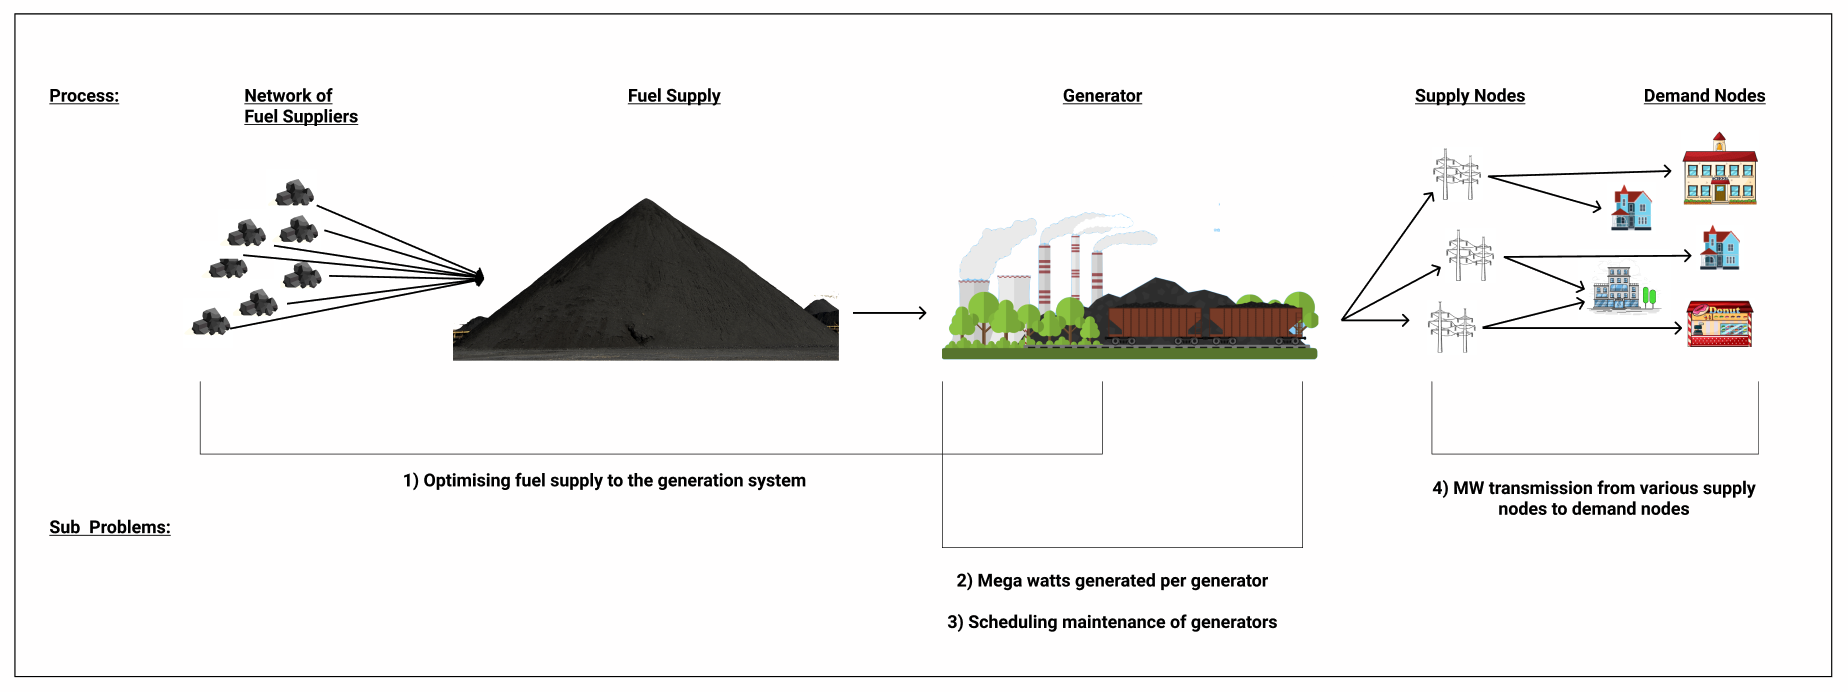
Figure 1. Diagram of Energy Creation Process and the sub-problems associated with each area.
To produce the outcomes outlined, Chattopadhyay (2001) analyses the entire energy production process and outlines the subproblems. The diagram below displays the system's process and which subproblems are associated with which subsystems.
3.2.2 Model Summary
A six-step method was developed by Chattopadhyay (2001) to optimise the maintenance schedule and minimise costs. It is as follows:
- Generators are to an extent randomly sampled, in a manner that will create a maintenance plan that can handle a large number generators that frequently lose power. The current maintenance schedule is considered when pooling which generators should be sampled first, and generators that experience forced (unplanned) power outages most frequently are sample first.
- Each sample set is used as input into the multi-objective relaxed LP one at a time. The LP has two objective functions: i) minimise total cost of system denoted by 'COST' and ii) minimise the variance of expected energy shortage denoted by 'VAR'. COST is not of too much importantance to the NREB unless there is a significant decrease. The second objective function VAR is of utmost importance as the NREB would like to continue uniformly distributing planned outages in the manner deemed most fair. Chattopadhyay then combines the two objective functions (COST/VAR) using Compromise Programming which was proposed by Zeleny (1982). The output of the relaxed LP is an approximated maintenance plan for those generators within the random sample along with recommended fuel supply, generation and transmission flow variables for each generator. Unfortunately this maintenance plan is not ideal because it does not ensure:
- That too many generators within one plant are being scheduled for maintenance simultaneously (this should be avoided)
- Maintenance won't be scheduled during peak demand
- To adjust for the faults of the LP model, a heuristic is used. The heuristic utilises all the outputs from the LP model to create a viable order for the maintenance plan.
- Now that the maintenance plan has been established it becomes a fixed variable, and the three other outputs (fuel supply, quantity generated and transmission flow) from the initial LP can be optimised based on the maintenance plan. The original LP is updated by removing the maintenance constraints as they're now obsolete. A new constraint and its associated variables PEAK, EUP and UFIC are added for monthly peak demand. The constraint "implicitly assumes a unit to be unavailable during the occurrence of the peak-load condition even if it is on maintenance for a small fraction of time" (Chattopadhyay, 2001, p.482).
- Steps 1 to 4 are repeated until all generators have been selected
- The expected outcome is computed by combining all sample sets
To recap, the first is a relaxed linear programming model to create an initial maintenance schedule. That initial maintenance schedule is not considered ideal based on the criteria that every region must experience maintenance power outages equally, so the schedule is further developed using a heuristic. Once the maintenance plan is established it is used in the second LP, which optimises for overall cost and 'variance of expected energy shortage over the 12 months' (Chattopadhyay, 2001).
Step 2: Linear Programming Equations
Objective Function 1:
\( COST = \sum_{ncg,m} (GEN)_{ncg,m} . SCOST_{ncg}\) \(+ \sum_{cg,m} (GEN)_{cg,m} . NFC_{cg}\)
\( + \sum_{s,q,c,k,r} (COAL)_{s,c,q,k,r} . \) \([TRCOST_r . DIST_{s,c,r}]\)
\( + \sum_{s,c,q,k,r} (COAL)_{s,c,q,k,r} . (MCOST)_{c,k}\)
\( + \sum_{i,m} (EUE)_{i,m} . (UECOST)_{i,m}\)
Cost is representative of the the entire process in the Figure 1 diagram for the upcoming year. It includes the costs to generate each MWh of energy from oil and gas, and coal, the cost of purchasing and transporting varying grades of coal from mines to mine-mouths and power stations, and the cost of energy shortages per area.
Objective Function 2:
\(VAR = w_1 \sum[EUE_{i,m} - EUE_i^*]^2 \) \(+ w_2\sum(EUE_i^*)^2\)
VAR represents minimising the variance of expected energy shortage (Chattopadhyay, 2001); 'i' specifies the area, 'm' the month, and 'w1' and 'w2' are weights. The minimum value VAR can hold is the average expected energy shortage within an area. It is squared to be of equal scale as the first half of the function. The weights can be used to experiment with the value of importance of each part of the equation. The VAR equation provides feedback on if the maintenance plan is good.
Compromising Function:
\(DISTANCE = W_{COST}. COST/Min COST \) \(+ W_{VAR}. VAR/Min VAR - CONSTANT\)
As mentioned before, Chattopadhyay (2001) uses Compromise Programming to merge the two objective functions. This establishes a relationship between the two individual objective functions. The objective is the minimise the distance between COST and VAR. Distance is 'the trade-off among the objectives, and also, whether there are good compromise solutions that may help NREB achieve reasonably uniform distribution of energy shortage at a modest increase in cost,' Chattopahyay (2001).
The objective functions are constrained by ten equations:
- # of MWh generated by each generator \(\leq\) availability of the generator less planned and unplanned outages
- generator capacity per hour times min hours \(\leq\) # of MWh generated by each coal-based generator (thermal power plant) \(\leq\) generator capacity per hour times max hours
- MWh generated from hydropower \(\leq\) max capacity of hydropower
- Unit availability \(\leq\)Length of time each generator has before it must receive maintenance (otherwise can result in damage)
- Unit availability \(\leq\) # of units in a station - 1 (ensures all units in one station are not scheduled at the same time)
- MWh generated from coal-based units = "efficiency of the power plant, caloric content of the fuel, and the quality of coal that it receives"
- Coal supplied \(\leq\) coal available from mines
- Coal supplied \(\leq\) quantity of coal that can be physically transported
- Energy demand (per state per month) + energy shortage = energy generated and energy transferred less losses
- Energy transferred from one state to the other \(\leq\) the physical capacity of the transmission lines
Step 3: Heuristic
Within the sample set, each generating unit has an associated vector containing its maintenance schedule that was recommended in step 2. An example vector is [0.2, 0.3, 0, 0.5] which indicates maintenance work for this specific generator will be completed in four months with the first 20% of maintenance completed in month one. The maintenance schedule is reviewed and based on a detailed set of criteria is decided whether to be kept or if it should be replanned so that the overall sample set's schedule can be better optimised (Chattopahyay, 2001). The heuristic is not expected to produce the most optimum results, but is used because it better addresses the NREB's focus on uniformly distributing planned (maintenance) power outages. The outcome of the heuristic is a fixed maintenance schedule within the sample set.
Step 4: The Updated Linear Programming Model
The initial LP is updated by replacing the maintenance variable 'U' with the fixed maintenance schedules 'U*'. To accommodate the change, other updates are made to the LP:
- Constraint #4, which specifies how long a generator can perform for before needing maintenance, and constraint #5, which ensures the maintenance of generators within the same plant are not scheduled simultaneously, are both removed.
- A new constraint is added: \((PEAK)_{i,m} + EUP_{i,m} =\) \( \sum DCAP_g.UFIX_{g,m} \) \(+ \sum T_{i,j,m}(1-LOSS_{i,j})\), which is used to better understand production capacity especially during peak demand by assuming a unit is entirely unavailable if there is any period of maintenance during peak-load time. Chattopadhyay (2001) is aware that this constraint may shrink power availability within the model, and so it is adjustable.
3.2.3 Outcomes and Suggestions
Compared to the previous approach of modelling the NREB's energy system Chattopadhyay's (2001) approach was more interconnected in terms of optimising for all the decision variables. System costs were lowered by redistributing which coal mines will be fuel supplies for power plants and by generating more energy in power plants where cost/MWh was lower and then transferring the energy to other areas. Overall it was estimated to decrease total cost by approximately 10% - approximately Rs 4.470 million and all four sub problems previously outlined have been addressed.
The cost objective function does not include costs for machinery depreciation or maintenance which decreases the accuracy of the model because it is unlikely the NREB will actually save that much money. Loss of load is mentioned in the monthly energy demand constraint, but it should be used better. Loss of load can be used as a measure of reliability (Kaldellis, 2010); decreasing shortages to increase reliability of the system should an objective of the NREB, not just maintaining the current distribution. Though cost is a great way to enumerate improvements, reliability would have been better so that less people can go without energy shortages. Volkanovski et al. (2008) minimised the loss of load probability in "Genetic algorithm optimisation of the maintenance scheduling of generating units in a power system". This can be used in a goal programming method so that the focus is on meeting a minimum improvement level.
The outcomes of Chattopadhyay's (2001) model prove that it is more efficient to increase production at some power plants and transfer the energy to demand nodes in other areas. Transmission capacity is a constraint caused by the physical power lines. It may be worth while to improve these.
3.3 Planning Municipal Energy Systems in Beijing
3.3.1 Introduction to Full Problem
In Beijing, research is focused on the long term planning of their energy systems. At the highest level their problem focuses on three main aspects: growing demand, scarce resources and environmental damage (both the present and future). The fast growth of demand is demonstrated by the rate of change in energy consumption: it measured 63.4 million tonnes of coal in 2008, 1.5 times higher than in 2001. Beijing itself does not have the fuel supply resources it needs to generate energy supply. These resource limitations and additional infrastructural limitations have forced Beijing to import a portion of their energy supply from nearby provinces at higher costs, and subject to conditions such as availability of excess supply and 'cost-barrier of transmission infrastructure' (Zhu et al., 2011).
Importance is placed on meeting demand, whether it is by increasing capacity or by importing higher-cost energy. The latter is more of a temporary solution, as Beijing plans to expand capacity and decrease air pollutants by installing clean-coal-fired, natural-gas-fired, landfill-gas-fired, and wind-power generation facilities. They would undoubtedly prefer to shift more of their energy supply to renewable resources to be more environmentally friendly, but the needed technologies and capacities are not yet available (Zhu et al., 2011).
This research concentrates on understanding and updating energy demand and supply usage patterns, which will support planning and expansion projects while managing economic cost versus environmental friendliness. Or, in Zhu et al.'s (2011) words, 'how to effectively alloc-ate energy and decide how to expand to minimise the net system cost'. The subproblems are as follows:
- Build an energy model based on methods mentioned in the next section
- Create a method that can include capacity expansion schemes inclusive of uncertainties
- Utilise outcome to inform Beijing on energy system planning and environmental management
3.3.2 Model Summary
Facility capacity, production efficiency, resource availability and allocation are all uncertainties that play significant roles within the model. Zhu et al. (2011) explore various methods of addressing the unpredictability of these uncertainties. They first examine Interval-Parameter Programming (IPP), which uses crisp intervals (a,b), but it does not provide the flexibility needed of the constraints to cope with uncertainties. IPP is regularly used in cases of uncertainty in the provision of utilities; a successful case of this was by Zarghami et al. (2015) to solve for the uncertainties involved with allocating water.
In the end, Zhu et al. (2011) selected an interval full-finite mixed-integer programming method to deal with the complex uncertainties and intricacies of expanding capacity. Its upper and lower bounds are defined by functional intervals, thereby making the model solvable because they are sensitive enough to the uncertainty of the inputs (Zhu et al., 2011). The final model is considered an 'Interval Full-Infinite Mixed-Integer Municipal-Scale Energy Model' (IFMI-MEM), and it contains both crisp and functional intervals.
The objective function's (Figure 2) complicated structure is a result of there being 18 different conversion technologies (methods) for generating electricity and heat. Within the function, revenue from selling electricity to other provinces and financial subsidies for pollution emissions are the only two sources of income. The function begins with the cost to purchase resources that will be converted into electricity and heat supply. Additionally, there are operational costs inclusive of machinery depreciation which is relative to specific time periods, conversion technologies and quantities of heat and electricity generated. For each conversion technology and energy type generated, there is a binary capacity expansion option that allows supply to meet the increased energy demand, giving Beijing the option of optimising the model with or without the expansion. Other expenses include transmission costs of electricity and pollution emission penalty costs.
The 18 conversion technologies are represented within the function as n = 1,...,18. n =1,...,9 are within electric power plants, n =10,11,12 in thermal power plants, and n =13,...,18 in heat plants, L = 5 years. Though the system is representative of costs over the next 15 years it can be easily adjusted for any number of years (if criteria remains the same).
Minimise \( f^\pm = \sum_{i=1}^{13}\sum_{k=1}^{13}CN_{ik}^\pm(\alpha_k^\pm) \) \(\times XN_{ik}^\pm \) \(- \sum_{j=1}^{6}\sum_{k=1}^{3}CO_{jk}^\pm(\alpha_k^\pm)\)
\(\times XO_{jk}^\pm \) \(+\sum_{m=1}^{2}\sum_{k=1}^{3}[PR_{mk}^\pm \) \(\times PC_{mk}^\pm (\eta_{mk}) + \sum_{q=1}^n YM_{qmk}^\pm \)
\( \times PA_{qmk} \times PI_{mk}^\pm(\theta)_{mk}] \) \(\times L + \sum_{n=1}^9\sum_{k=1}^3[PDR_{nk}^\pm \) \(\times PDC_{nk}^\pm(\beta_{nk}) \)
\( + \sum_{q=1}^nYP_{qnk}^\pm \times PDA_{qnk} \) \(\times PDI_{nk}^\pm (\gamma_{nk})] \) \(\times L \)
\( + \sum_{n=10}^{12}\sum_{k=1}^3 [PRR_{nk}^\pm \) \(\times PRC_{nk}^\pm(\delta_{nk}) \) \(+ HRR_{nk}^\pm \) \(\times HRC_{nk}^\pm(\epsilon_{nk}) \)
\( + \sum_{q=1}^3 YH_{qnk}^\pm \) \(\times PRA_{qnk} \) \(\times PRI_{qnk}^\pm(\zeta_{nk})] \) \(\times L \)
\( + \sum_{n=13}^{18}\sum_{k=1}^3 [PGR_{nk}^\pm \) \(\times PGC_{nk}^\pm(\mu_{nk}) + HGR_{nk}^\pm \) \(\times HGC_{nk}^\pm(\pi_{nk})] \)
\( \times L \) \(+ \sum_{n=1}^9\sum_{k=1}^3 (PDR_{nk}^\pm \) \(+ \sum_{q=1}^3 YP_{qnk}^\pm \times PDA_{qnk} \) \(\times h_k) \) \(\times (1-SL_k) \)
\( \times CU_k \) \(\times L \) \(+ \sum_{n=10}^{12}\sum_{k=1}^3 [PRR_{nk}^\pm \) \(+ \sum_{q=1}^3 YH_{qnk}^\pm \) \(\times PRA_{qnk} \)
\( \times (1-PRB_k) \) \(\times h_k] \) \(\times (1-SL_k) \) \(\times CU_k \times L \)
\( + \sum_{n=13}^{18}\sum_{k=1}^3 [PGR_{nk}^\pm \) \(\times (1-SL_k) \) \(\times CU_k \times L \)
\( + \sum_{n=1}^{9}\sum_{k=1}^3 (PDR_{nk}^\pm \) \(+ \sum_{q=1}^3 YP_{qnk}^\pm \) \(\times PDA_{qnk} \times h_k) \times (CP_{pk}^\pm \)
\( + CE_{pk}^\pm/h_k-SU_k) \) \(\times L + \) \(\sum_{n=10}^{12}\sum_{k=1}^3[PRR_{nk}^\pm \) \(+ HRR_{nk}^\pm \)
\( + \sum_{q=1}^3YH_{qnk}^\pm \times PRA_{qnk}^\pm \) \(\times (1-PRB_k) \times h_k] \) \(\times (CP_{pk}^\pm \)
\( + CE_{pk}^\pm/h_k - SU_k) \) \(\times L \) \(+ \sum_{n=13}^{18}\sum_{k=1}^3 (PGR_{nk}^\pm \) \(+HGR_{nk}^\pm) \)
\( \times (CP_{pk}^\pm \) \(+ CE_{pk}^\pm/h_k-SU_k) \times L \)
The objective function above is constrained by: 1) supply and demand, 2) a capacity limit on pollution emissions, 3) funding for expansion, and 4) non-negativity for decision variables. Decision makers have the ability to easily modify constraints as needed. They are as follows:
I. Supply:
- Supply of fuel resources \(\leq\) resources available
II. Mass of Balance:
- Amount of heat generated from n in period k (from both existing technological capacity and from capacity expansion) \(\geq\) (1 + heat loss) times total heat demand
- Amount of electricity generated from n in period k (from both existing technological capacity and from capacity expansion) \(\geq\) (1 + transmission loss) n total electricity demand
- Total electricity generated \(\geq\) 0 (non-negativity constraint)
III. Demand:
- Total energy generated - energy sold (to other regions) > demand
- Energy generated by each processing technology type in period k \(\geq\) demand of Energy from each processing technology type in period
- Electricity generated in electric power plant for each energy type \(\geq\) Electric demand
- Heat generated from coal, oil and gas in thermal power plant \(\geq\) Heat demand
IV. Environmental
- There is an upper bound limit on each type of pollution
V. Expansion Costs (Funding Limits for):
- Electric power plant expansion for each type of power processing technology (coking or oil refining) in period k
- Electric power plant expansion for each type of power conversion technology (eg. wind, oil-generated, etc) in period k
- Thermal power plant expansion conversion technology in period k for each type of resource that can be converted into heat
VI. Non-Negativity, for the following decision variables:
- Quantity of local energy supplied for each energy type i in period k
- Quantity of local energy supplied for each energy type i in period k to be transfer to another province
- Quantity of energy generated by processing technology m (coking or oil-refining) in period k
- Quantity of electricity generated by conversion technology n in electric power plants in period k
- Quantity of electricity generated by conversion technology n in thermal power plants in period k
- Quantity of heat generated by conversion technology n in thermal power plants in period k
3.3.3 Outcome and Suggestions
The objective function's outcome is total cost of the system over 15 years \(f_{opt}^\pm\)= RMB¥[709.14, 3208.25] x 1012. The range of the results is attributed to the range of the interval inputs; the lower and upper bounds of the outcome are the product of parameters either all at the lower bound or all at the upper bound. Zhu et al (2011) describes the spectrum of cost to be the "tradeoffs between system costs and reliability." As is expected, there is a positive relationship between system costs and reliability. Furthermore, "the model can be used for examining the relations between system cost and resource availability." Ultimately, the lower bound represents the lowest cost the system may have to still produce sufficient results, but to gain more reliability costs will increase.
Interval results in period k = 1,2,3 are for the following variables:
- Local energy supply for i = 1,..., 13 where i is energy/resource purchased
- Energy supply for transfer for i = 1,...,13
- Amount of energy generated by process technology m where m = coking or oil refining
- Amount of electricity generated by conversion technology n =1,...,9 in electric power plant
- Amount of electricity generated by conversion technology n =10,11,12 in thermal power plant
- Amount of heat generated by conversion technology n =13,...,18 in thermal power plant
- Binary capacity expansion option for conversion technology n =1,...,9 in electric power plant
- Binary capacity expansion option for energy processing technology m in thermal power plant
- Binary capacity expansion option for conversion technology n =10,11,12 in thermal power plant
The only financial constraint was on capacity expansion. This resulted in there being an approximately 2.5 quadrillion renminbi difference between the lower and upper bounds of the objective output. With such a variation it seems as though it would make decision-making difficult. To further decision-making it would be beneficial to extend this project to use multi-criteria decision making to finalise which is the best course of action. In Algeria, Haddad et al. (2017) used this approach to decide which concept would be best for transforming their energy system from exclusively relying on fossil fuels to also including non-renewable energies.
As China's energy demands continue to grow so do air pollutants - SO2, NOx and PM10. In China, 90% of SO2 and 67% NOx emissions are caused by coal (Chen & Xu, 2010).If the same types of resources and conversion methods continue to be used as demand grows air pollution will inevitably worsen. Zhu et al. (2011) mentioned that the 'environmental protection goal' will force the reduction of coal-fired and gas-fired energy production, and the government has shown interest in expanding their use of natural gas which has lower pollution emissions. Alternatively, mixtures of coal and biomass have been shown to reduce pollutants SO2 by up to 7-12% and NOx by 45% (Narayanan & Natarjan, 2006).
China makes a lot of effort to invest in clean-coal and renewable resources research. This model only uses traditional forms of energy conversion (Zhu et al., 2011). In a way, this makes the model outdated. If the model is to plan for the coming 15 years, it should include non-traditional sources of energy as an option like it does with the binary capacity expansion. Clean energy is currently more expensive than non-renewable energies, and so it may be useful to analyse how much more expensive clean energy is per MWh.
Lastly, a major flaw in this model is that it does not include peak energy demand or peak energy supply. If the model cannot realistically plan for when the energy system is most strained, it is unlikely to meet the needs of energy demand and contribute enough to solving the energy crisis in Beijing.
3.4 Comparison of Methods
To recap, the two models aim to close the gap on energy demand shortages through planning, but proceed to do so very differently. For the NREB in India, the distribution of planned shortages must be allocated fairly, and their outlook is only up to the coming year. In Beijing, the model encompasses the next 15 years; it includes opportunities for expanding energy supply capacity, and places emphasis on reducing air pollution.
Both models are based on linear programming techniques. Uncertainty is a shared common theme that has been dealt with very differently. Chattopadhyay (2001) uses Monte Carlo simulation to model the random power outages that are of probabilistic nature, while Zhu et al. (2011) use functional intervals to capture the range of uncertainty expected in resource supply, future demand, etc. Furthermore, their constraints reflect their similarities and differences. They each host equations for energy supply, resources supply, transmission, energy demand and mass balance constraints, but maintenance, environmental impact, and funding constraints are not shared by the two.
Neither model seems to be holistically complete. As mentioned before, Chattopadhyay (2001) does not include all costs within the cost objective function, and Zhu et al. (2011) do not consider peak demand or supply. So, albeit useful these models probably should not be given full trust.
3.5 Conclusion
Energy supply is an ongoing problem many countries face. Cheaper sources of energy production come at the cost of the environment and citizens' health. Though research is being done to convert to less harmful energy supply, one of the adversities to transitioning is increased cost and who will be responsible for bearing it.
It is likely that energy supply will remain an ongoing issue for many countries. It is not an easy task to predict the uncertainties of future demand or be able to prepare for it. Within the energy system there are many subsystems which pose as risks to meeting demand such as resource availability, technology and capacity.
Linear Programming has proven to be a versatile modelling method that can be manipulated to address a variety of problems.
4. Overall Conclusion
Developing Countries can benefit from methods of operational research. In the past mathematicians have used operational research to assist with alleviating child malnutrition, allocating health professionals, easing pollution from transportation, and many other problems. Unfortunately, past successes are not enough to always motivate using operational research in developing countries. Other than a lack of financial resources there are several challenges obstructing developing countries from moving towards using operational research. They may not have the skilled human capital to model the research or build the infrastructure needed to host necessary data. It is also an unfortunate fact that corruption is prevalent in many developing countries, and optimising processes may not be to the benefit of those involved. If developing countries are to advance governments of these countries must shoulder the responsibility of being the driving force of the imperative cultural changes.
REFERENCES
- Ahmed, M.A. and Alkhamis, T.M. (2008) Simulation optimization for an emergency department healthcare unit in Kuwait. European Journal of Operational Research, 198, 936-942
- Bandeira, R., D'Agosto, M., Ribeiro, S., Bandeira, A. And Goes G. (2018) A fuzzy multi-criteria model for evaluating sustainable urban freight transportation operations. Journal of Cleaner Production, 184, 727-739
- Bornstein, C.T. and Rosenhead, J. (1990) The role of Operational Research in less developed countries: A critical approach. European Journal of Operational Research, 49, 156-178
- Chattopadhyay, D. (2001) Production and maintenance planning for electricity generators: modeling and application to Indian power systems. International Transactions in Operational Research, 8, 465-490
- Chen, W. and Xu, R. (2010) Clean coal technology development in China. Energy Policy, 38 (5), 2123-2130
- Docquier, F., Lohest, O. And Marfouk, A., (2007) Brain Drain in Developing Countries. The World Bank Economic Review, 21 (2), 2007, 193-218.
- Fahmida, U., Kolopaking, R., Santika, O., Sriani, S., Umar, J., Htet, M.K and Ferguson, E. (2015) Effectiveness in improving knowledge, practices, and intakes of "key problem nutrients" of a complementary feeding intervention developed by using linear programming: experience in Lombok, Indonesia. American Society for Nutrition, 101, 455-461
- Ferguson, E., Darmon, N., Fahmida, U., Fitriyanti, S., Harper, T. and Premachandra, I. (2006) Design of Optimal Food-Based Complementary Feeding Recommendations and Identification of Key "Problem Nutrients" Using Goal Programming. he Journal of NutritionT, 136, 2399-2404
- Goyal, S.K. and Yadav, J.P. (1979) Allocation of Doctors to Health Centres in Haryana State of India A Case Study. The Journal of the Operational Research Society, 30 (5), 427-431
- Haddad, B., Liazid, A. and Ferreira, P. (2017) A multi-criteria approach to rank renewables for the Algerian electricity system. Renewable Energy, 107, 462-472
- Kaldellis, J.K. (2010) Stand-Alone and Hybrid Wind Energy Systems. United Kingdom: Woodhead Publish Limited. Available from: URL Link [Accessed 28 April 2020]
- Khayal, D., Pradhananga, R., Pokharel, S. And Mutlu, F. (2015) A model for planning locations of temporary distribution facilities for emergency response. Socio-Economic Planning Sciences, 52, 22-30
- Kilci, F., Kara, B.Y. and Bozkaya, B. (2014) Locating temporary shelter areas after an earthquake: A case for Turkey. European Journal of Operational Research, 243, 323-332
- Long, J. and Brindley, W. (2013) The role of big data and analytics in the developing world. Accenture. Available from: URL Link [Accessed 24 April,2020]
- Luna, D., Mayan, J.C., García, M.J., Almerares, A.A. and Mowafa, H., et al. (2014) Challenges and potential solutions for big data implementations in developing countries. Yearb Med Inf. 9, 36-41
- Miandoab, M.H., Ghezavati, V. and Mohammaditabar, D. (2019) Developing a simultaneous scheduling of passenger and freight trains for an inter-city railway considering optimization of carbon emissions and waiting times. Journal of Cleaner Production, 248, 119303
- Narayanan, K.V. and Natarajan, E. (2006) Experimental studies on cofiring of coal and biomassblends in India. Renewable Energy, 32, 2548-2558
- Parker, B., Stansfield, S., Boulos, R., Augustin, A. and Newman J. (1988) OPTIMIZATION OF TASK ALLOCATION FOR COMMUNITY HEALTH WORKERS IN HAITI. Socio-Economic Planning Sciences, 22 (1), 3-14
- Petralia, S., Balland, P.A. and Morrison, A. (2017) Climbing the ladder of technological development. Research Policy, 46 (5), 956-969
- Pritchett, L. (1997) Divergence, Big Time. The Journal of Economic Perspectives, 11 (3), 3-17
- Romero, C. (1991) Handbook of Critical Issues in Goal Programming. Great Britain: BPCC Wheatons Ltd. Exeter. Available from: URL Link [Accessed 24 April 2020].
- van Dooren, C. (2018) A Review of the Use of Linear Programming to Optimize Diets, Nutritiously, Economically and Environmentally. Frontiers in Nutrition, 5 (48)
- Volkanovski, A., Mavko, B., Bosevski, T., Causevski, A. and Cepin, M. (2008) Genetic algorithm optimisation of the maintenance scheduling of generating units in a power system. Reliability Engineering & System Safety, 93 (6), 779-789
- Whitea, L., Smith, H. And Currie C. (2011) OR in developing countries: A review. European Journal of Operational Research, 208 (1), 1-11
- Zarghami, M., Safari, N., Szidarovsky, F. and Islam, S. (2015) Nonlinear Interval Parameter Programming Combined with Cooperative Games: a Tool for Addressing Uncertainty in Water Allocation Using Water Diplomacy Framework. Water Resoures Management, 29, 4285-4303
- Zhu, Y., Huang, G.H., Li, Y.P., He, L. and Zhang, X.X. (2011) An interval full-infinite mixed-integer programming method for planning municipal energy systems - A case study of Beijing. Applied Energy, 88, 2846-2862