INSIGHT INTO HIV WITHIN THE UK BETWEEN 2009 AND 2018
Problem Brief
Given HIV data answer the following questions by provide an informative and insightful description of HIV within the UK using a variety of charts and analysis techniques. (1) How has the distribution of new HIV cases changed between 2009 and 2018? (2) Is the national trend in the three key HIV indicators (new HIV cases, HIV deaths and number of people on treatment) the same for men and women? (3) Are there any obvious differences in behaviour between the different UK regions?
Solution Report
All graphs and analysis completed in R.
How has the distribution of new HIV cases changed between 2009 and 2018?
Gender Distribution
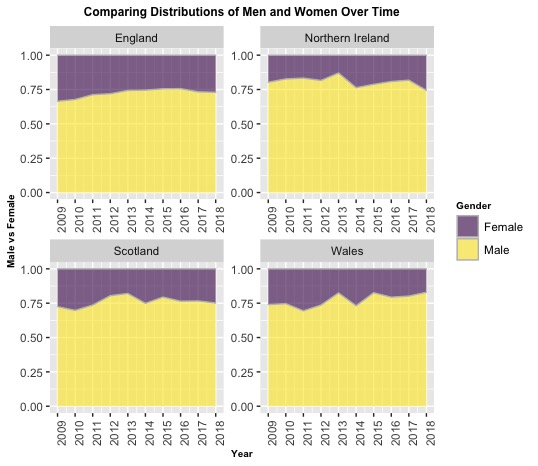
The following graphs consider the distribution change of men and women within the four nation states of Great Britain diagnosed with HIV annually. Typically, the ratio of men to women hovers around 3:1. Excluding England, there was a drop in 2014, indicating there was a greater percentile increase of females diagnosed over the prior year. Comparing the gender distribution of 2009 to 2018:
England: There is a slight but steady decrease in women diagnosed, indicating that both genders are decreasing at similar rates.
Northern Ireland: Females' share of the distribution has grown compared to the early years, suggesting that male rates are decreasing faster.
Scotland: Males' share experienced an increased in 2012, and continues to decrease at slower rates than women (with the exception of 2014)
Wales: The female proportion of the distribution has almost halved in 2018 when compared to 2009.
Using Age Groups to Compare New Cases in Different Regions
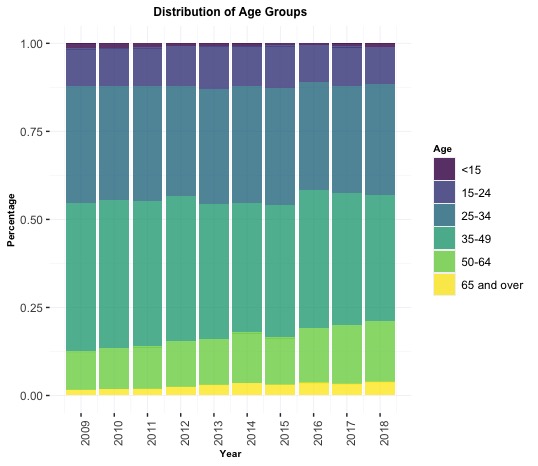
The distribution of new cases amongst the different age groups have each had moderate changes over the course of 10 years. Unlike most other age groups, those in age groups 50-64 and 65 and over increased in number of cases of HIV over the years, thereby increasing their distribution within all new diagnosis.
In contrast, new HIV cases in age groups <15 and 35 to 49 are decreasing at faster rates and therefore shrinking in distribution. Despite the changes, the age groups which outweighed others in 2009 still do in 2018 ( as expected since these are the ages people are more sexually active).
Is the national trend in the three key HIV indicators (new HIV cases, HIV deaths and number of people on treatment) the same for men and women?
New HIV Cases
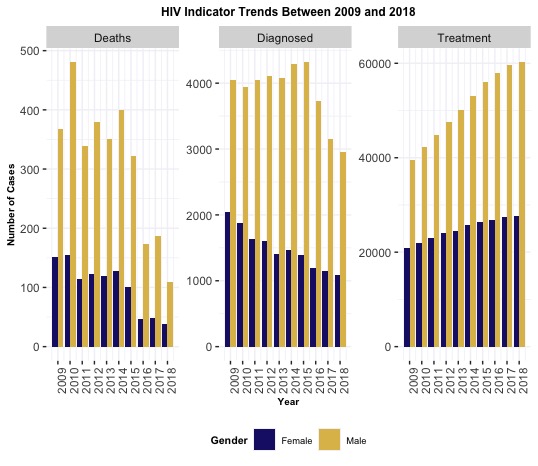
During the last 10 years (2009 to 2018) there has been a 32.4% decline in the number of diagnosed HIV cases throughout the UK. In 2015 there was a particularly sharp drop in cases for both genders. While both genders saw a shift towards lower annual diagnoses, numbers for women decreased by 46% while those for men decreased by 26%.
Deaths
The number of deaths due to HIV fluctuated between 2009 to 2015. Deaths of men and women follow a parallel pattern, albeit at a much different scale. Within 2 years (2014 to 2016) the number of deaths per annum due to HIV fell by over 50% for both genders. It is important to note that death is impacted by factors such as past diagnoses, CD4 levels at diagnosis, and quality of treatment
Treatment
The national trend for number of people receiving treatment is increasing for both men and women at uniform rates with numbers corresponding to the number of people diagnosed within each respective gender.
Are there any obvious differences in behaviour between the different UK regions?
CD4 Levels at Diagnosis
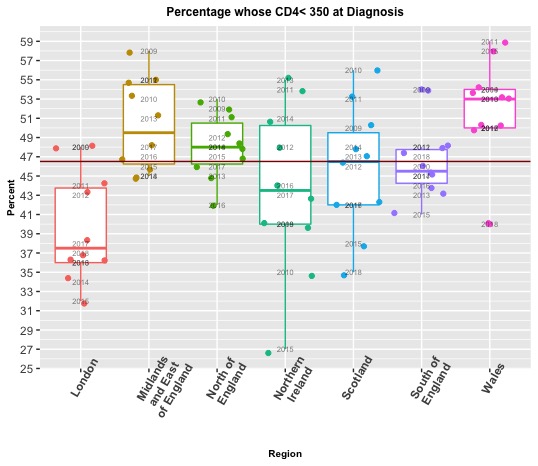
Approximately 47% of HIV cases are diagnosed when CD4 levels are dangerously low (below 350). The worst case occurred in Wales in 2011, when 59% of HIV diagnoses had CD4 levels below 350, and in the best circumstances in Northern Ireland in 2015 when 27% of HIV diagnoses had CD4 levels below 350. The varying lengths of the interquartile ranges for the different regions demonstrate how inconsistent regions are at identifying HIV. Generally, London has diagnosed HIV positive persons when their CD4 levels are higher than 350, which gives them a better survival rate. Conversely, Wales is almost always worse than average, but did improve in 2014 by spotting 60% of new cases before CD4 levels dipped below 350.
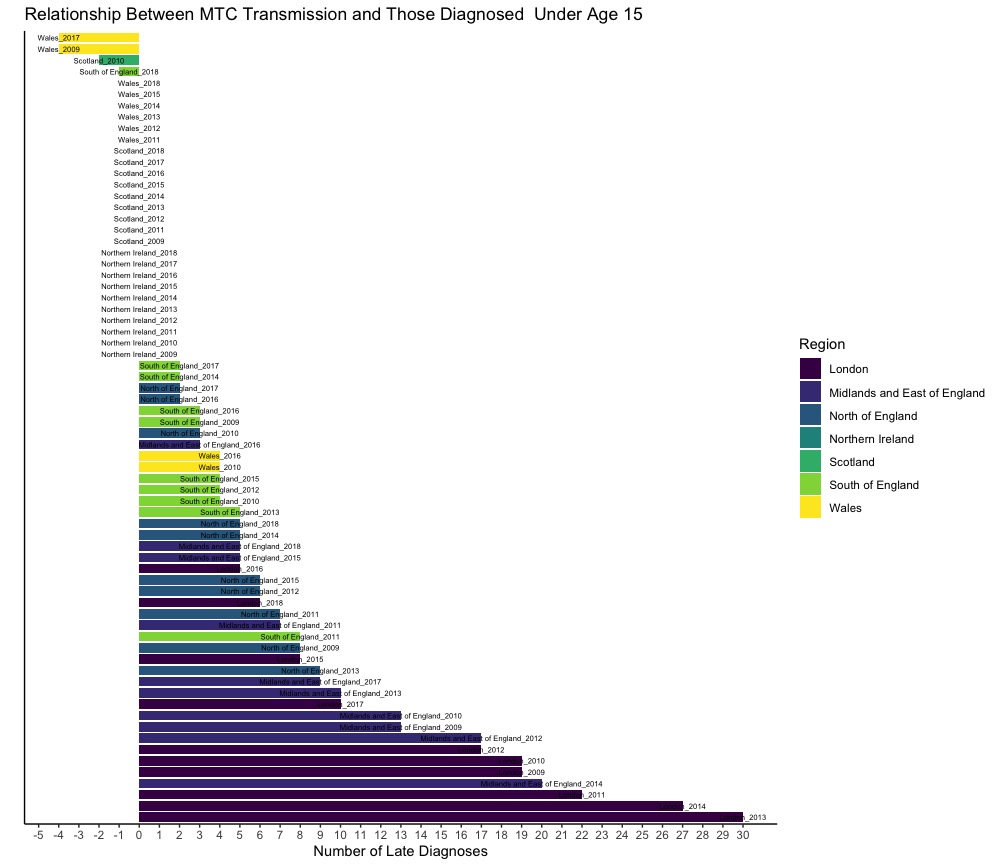
The Relationship Between Mother to Child (MTC) Transmission and Diagnosis Under Age 15
The relationship between MTC transmission and diagnosis under age 15 shows us how many children living with HIV are unaware of their condition, as they have either not yet been diagnosed or were diagnosed at a much later age even though they contracted HIV pre/post birth. In cities where there are fewer cases of HIV, medical doctors have been better at catching HIV early; in contrast, larger cities such as London were more likely to leave cases undiagnosed. This could be because the doctors were unaware of the mother's HIV status.
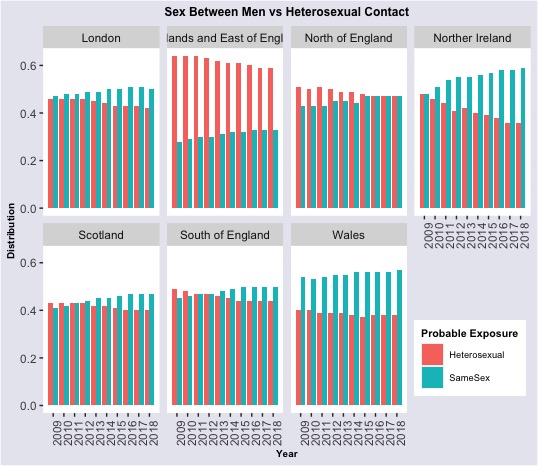
Probable Exposure at Diagnosis: Sex Between Men vs Heterosexual Contact
86.5% of cases during 2009 to 2018 HIV was contracted through behavioural exposure (either from sex between men or heterosexual contact). The graphs below show how these two subcategories of exposure compared to one another for new HIV cases over the years. In many regions sex between men and heterosexual contact are equally responsible for spreading HIV, although over time the portion due to sex between men grows (and in most regions outweighs heterosexual contact). Unlike the majority of the UK, heterosexual contact is the main cause of spreading HIV within the Midlands and East of England. This growing concentration of HIV contact from sex between men correlates to why new cases of HIV are continuously more likely to be from men than women.
Summary
The overall HIV climate has shown significant improvement over the last 10 years. Deaths due to HIV and new diagnoses per annum have notably decreased, whilst an upsurge transpired in those receiving the needed healthcare. The year-over-year gains of treatment numbers can be attributed to advancements in medication, which in conjunction with the dwindling number of new cases also directly relates to shrinking death rates. If the number of new cases continues to decrease we can expect to see treatment numbers wane in the future. Even though HIV is generally declining, the Gender Distribution graphs reveal that it is not doing so equally between men and women. The shifts towards a greater percentage of cases coming from men can be attributed to the rising percentage of HIV exposure through sex between men. Like gender, the distribution amongst age groups is disproportionate - the three youngest age group account for lesser cases, while also shrinking over time. One speculation is that these age groups are continuously becoming more aware and educated about HIV. Unfortunately, 47% of the time HIV goes unnoticed until CD4 levels are already below 350. It is difficult to specify a reason as to why people are diagnosed so late, as there are many potential factors. For example, in the case of Mother To Child transmission, mothers of children who aren't diagnosed until later on in life may not have been aware that they were carrying HIV while pregnant. Overall, people with HIV need to be accurately diagnosed sooner, as this will not only improve the individual's chance of survival, but also increase awareness and potentially prevent further spread of HIV.