PREDICTING THE PRESENCE OF CORONARY HEART DISEASE
Problem Brief
Develop a model that can predict the presence of Coronary Heart Disease in response to certain variables, then use the model to describe the individual effects of obesity and age on the likelihood of heart diseases. (Word Limit: 400)
Solution Report
Method: Logistic Regression, Program: Matlab
In Western Cape, South Africa many residents have a high risk of suffering from Coronary Heart Disease (CHD). A study is conducted to understand which health conditions and life style habits can be connected to CHD. Systolic blood pressure (sbp), tobacco, bad cholesterol (ldl), famhist, obesity, alcohol and age are used as predictors on the binary response variable CHD for 462 participants. A logistic regression model is used:
\(logit (\mu_i) = \sum_{i=1}^n X_{j,i}\beta_j\) where j represents predictor variables within Figure 1, and i individual records of each.
Figure 1. Logistic Regression Model for Predicting the probability of CHD based on the input variables.
| Variable | Coefficient | t value | Average | Person Corr. to Y | Spearman Corr to Y |
|---|---|---|---|---|---|
| 2: sbp | -0.07538 | -1.81 | 138 | 0.192 | 0.172 |
| 3: tobacco | 0.08259 | 3.12 | 3.64 | 0.3 | 0.323 |
| 4: ldl | 0.2006 | 3.42 | 4.74 | 0.263 | 0.271 |
| 5: famhist | 0.9684 | 4.25 | 0.416 | 0.272 | 0.272 |
| 6: obesity | -0.5205 | -2.56 | 26 | 0.1 | 0.108 |
| 8: age | 0.6753 | 2.51 | 42.8 | 0.373 | 0.367 |
| 9: sbp2 | 0.000271 | 1.97 | 1.96e+04 | 0.196 | 0.172 |
| 11: obesity2 | 0.008506 | 2.41 | 696 | 0.0979 | 0.108 |
| 15: age2 | -0.01469 | -2.22 | 2.05e+03 | 0.366 | 0.367 |
| 16: age3 | 0.000108 | 2.06 | 1.05e+05 | 0.353 | 0.367 |
| Deviance | 471.60 | ||||
| Deg. Freedom | 452.00 | ||||
| AIC | 491.60 |
The predictors sbp, obesity and age2 are negatively correlated, decreasing the probability of CHD, whereas the other predictors increase the probability. Both sbp and sbp2 have a t-value <|2| indicating that they are insignificant (at 95% significance level), but when removed the AIC increases- becoming a worse model.
To understand how the predictors age and obesity have impacted the model the following is plotted for each \(e^{x_i\beta_{age}+ x_i^2\beta_{age^2} +x_i^3\beta_{age^3}}\) and \(e^{x_i\beta_{obesity}+ x_i^2\beta_{obesity^2}} \) respecitvely.
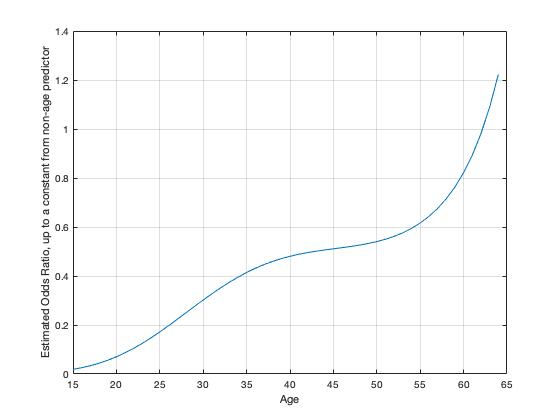
(L) Figure 2: The effect of age on the odds ratio
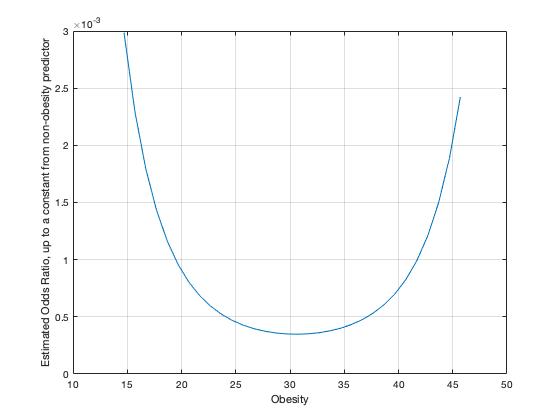
(R) Figure 3: The effect of obesity on the odds ratio
From Figure 2. It can be seen that age has a dramatic effect on increasing the odds (ranging from 1,323.9 to 84,944) of P(CHD=1), and as age increases so does its influence. Of the ten predictors 3 are age variables, it is likely that age affects the probability of CHD more than any other variable type. Obesity on the other hand, has less of an effect on \(logit (\mu_i)\); in the presence of the other predictors obesity's highest effect on the odds of P(CHD=1) is 0.0029886 at obesity=14.7. Obesity has the least amount of effect (.000348) when obesity= 30.7. Though the coefficient of obesity is negative and obesity2 is positive the overall effect of obesity on P(CHD=1) is positive.
When age is plotted against CHD without any of the other predictor variables P(CHD=1) increases with age at a more constant rate than the odds ratio. According to the linear and quadratic models, obesity without other predictors also increases as obesity increases. The cubic model shows that those having the lowest probability of experiencing CHD are within the healthy obesity range (~19-24). These outcomes are unlike obesity in the presence of other predictors where the minimum influence occurs when one is considered obese ( obesity range: 30-39).
That is to say, in the presence of other predictors the coefficients of each variable do not necessarily represent the individual predictors influence on P(CHD=1) as they are altered by multicollinearity.
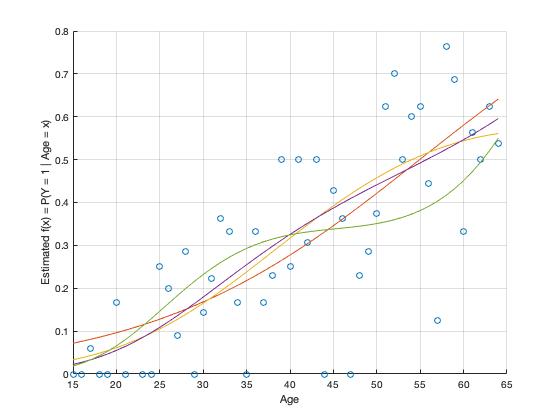
(L) Figure 4: Plot of linear (orange), quadratic (yellow) and cubic (purple) equations of age, and \(\mu(x)\) = age, age2 and age3 (green)
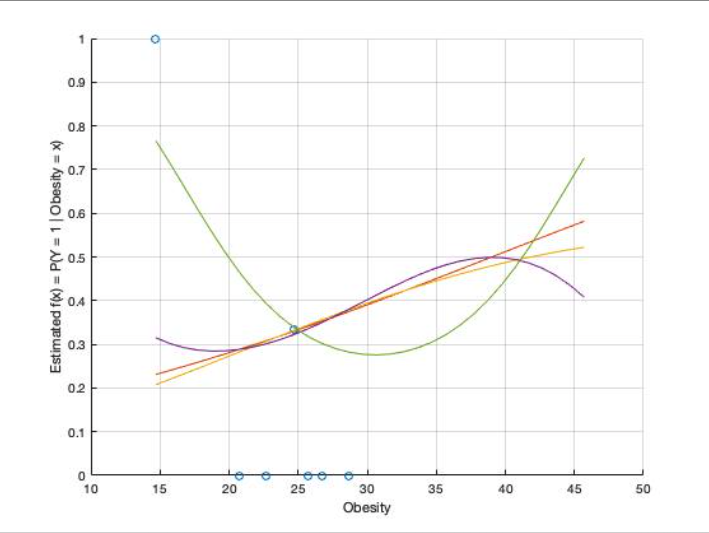
(R) Figure 5: Plot of linear (orange), quadratic (yellow) and cubic (purple) equations of obesity, and \(\mu(x)\) = obesity, obesity2 (green)
Appendix
Model Selection Method:
The process begins with including all variables. The AIC is documented, then the variable with the lowest t-value below absolute 2 is removed and the model is recalculated. This process continues until either all individual variables are within 95% confidence level, or the lowest AIC is found.
Table 1: Logit, and age, ,age2 and age3
| Trial No. | Columns | AIC | Trial No. | Columns | AIC | |
|---|---|---|---|---|---|---|
| 1 | 1:16 | 502.96 | 5 | 1:6, 8, 9, 11, 12, 15, 16 | 495.23 | |
| 2 | 1:6, 8:16 | 500.99 | 6 | 1:6, 8, 9, 11, 15, 16 | 493.39 | |
| 3 | 1:6, 8:13, 15, 16 | 499.06 | 7 | 2:6, 8, 9, 11, 15, 16 | 491.6 | |
| 4 | 1:6, 8, 9, 11:13, 15, 16 | 497.13 | 8 | 3:6, 8, 9, 11, 15, 16 | 493.04 |
Table 2: Probit, and age, ,age2 and age3
| Trial No. | Columns | AIC | Trial No. | Columns | AIC | |
|---|---|---|---|---|---|---|
| 1 | 1:16 | 502.85 | 5 | 1:6, 8, 9, 11, 12, 15, 16 | 495.17 | |
| 2 | 1:6, 8:16 | 500.87 | 6 | 1:6, 8, 9, 11, 15, 16 | 493.4 | |
| 3 | 1:6, 8, 9, 11:16 | 498.95 | 7 | 2:6, 8, 9, 11, 15, 16 | 491.95 | |
| 4 | 1:6, 8, 9, 11, 12, 14:16 | 497.104 | 8 | 3:6, 8, 9, 11, 15, 16 | 492.92 |
Table 3: Logit, and categories of age with binary inputs
| Trial No. | Columns | AIC | Trial No. | Columns | AIC | |
|---|---|---|---|---|---|---|
| 1 | 1:7, 9:14, 22:30 | 510.47 | 5 | 1:6, 9;11, 23:30 | 503.18 | |
| 2 | 1:7, 9:11, 13, 14, 22:30 | 506.86 | 6 | 1:6, 9, 11, 23:30 | 501.18 | |
| 3 | 1:6, 9:11, 13, 14, 23:30 | 506.65 | 7 | 1:6, 9, 11, 23:25, 27:30 | 501.46 | |
| 4 | 1:6, 9:11, 13, 23:30 | 504.85 | 8 | 1:6, 11, 23:25, 27:30 | 502.16 |
Table 4: Probit, and categories of age with binary inputs
| Trial No. | Columns | AIC | Trial No. | Columns | AIC | |
|---|---|---|---|---|---|---|
| 1 | 1:7, 9:14, 22:30 | 508.81 | 6 | 1:6, 9, 11, 22:30 | 499.38 | |
| 2 | 1:7, 9:11, 13, 14, 22:30 | 506.86 | 7 | 1 3:6, 9, 11, 22:30 | 500.19 | |
| 3 | 1:7, 9, 11, 13, 14, 22:30 | 504.98 | 8 | 1, 3:6, 11, 22:30 | 499.96 | |
| 4 | 1:7 9 11 14 22:30 | 503.06 | 9 | 3:6 11 22:30 | 499.69 | |
| 5 | 1:6 9 11 14 22:30 | 501.19 | 10 | 3:6 11 23:30 | 501.65 |